How the forecast turns a chaotic World Cup into a travel plan.
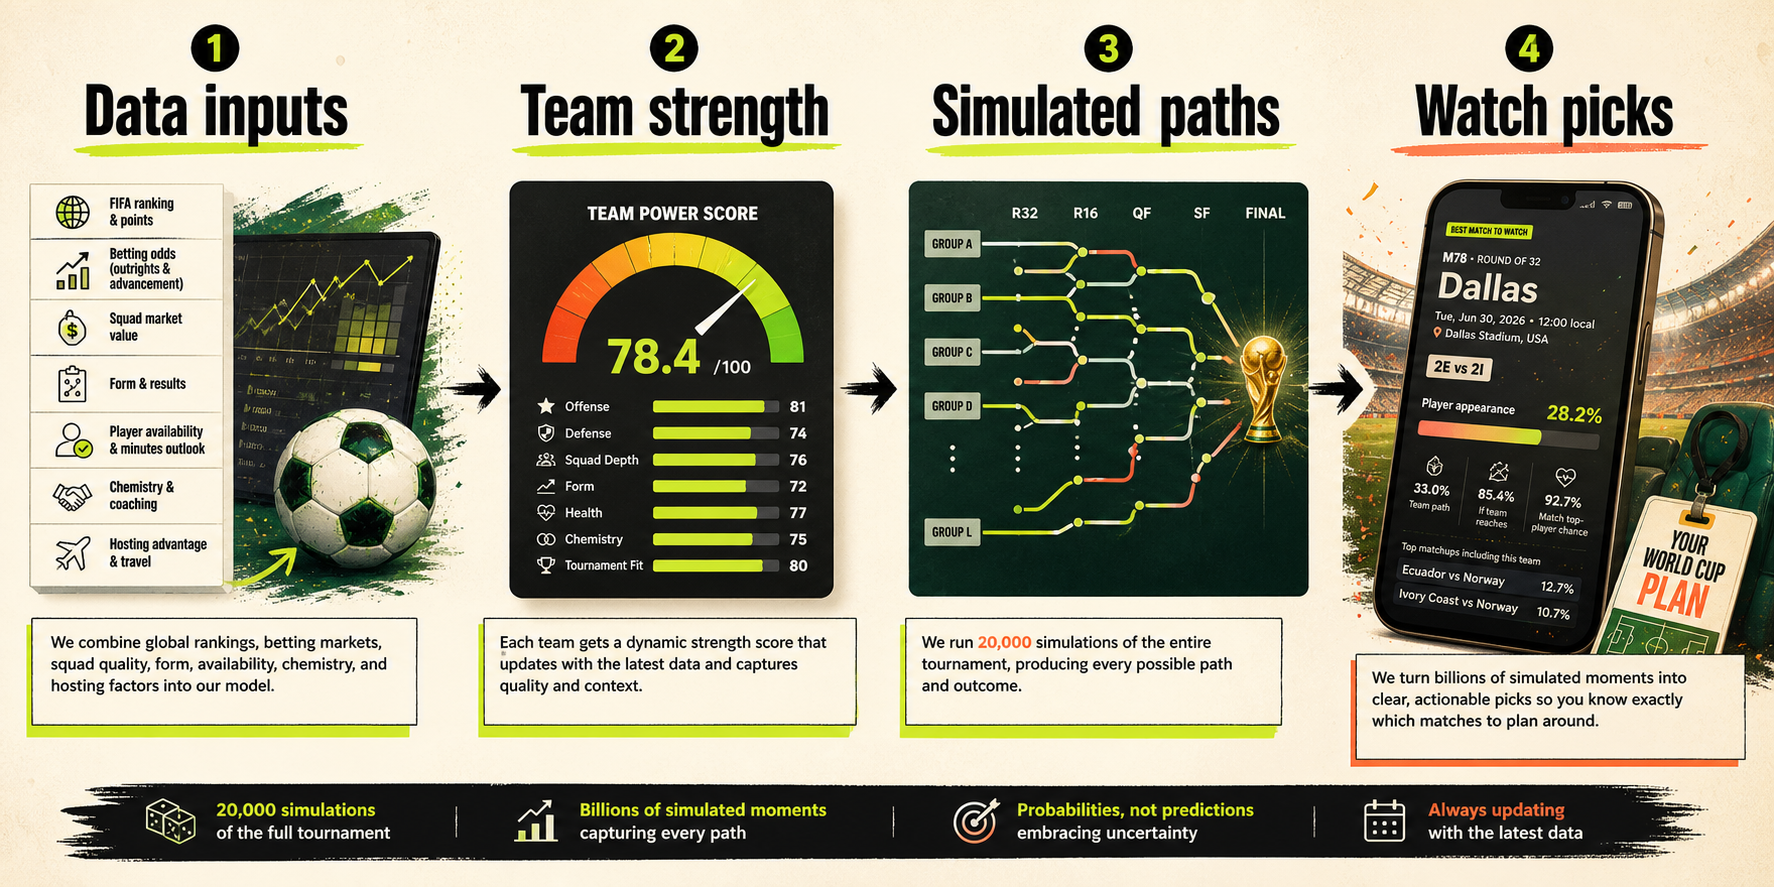
The model does not claim to know the future. It repeatedly simulates the tournament from team strength, market priors, roster context, and player availability, then counts how often each team, player, and possible matchup lands in each knockout slot.
Data
What data goes in?
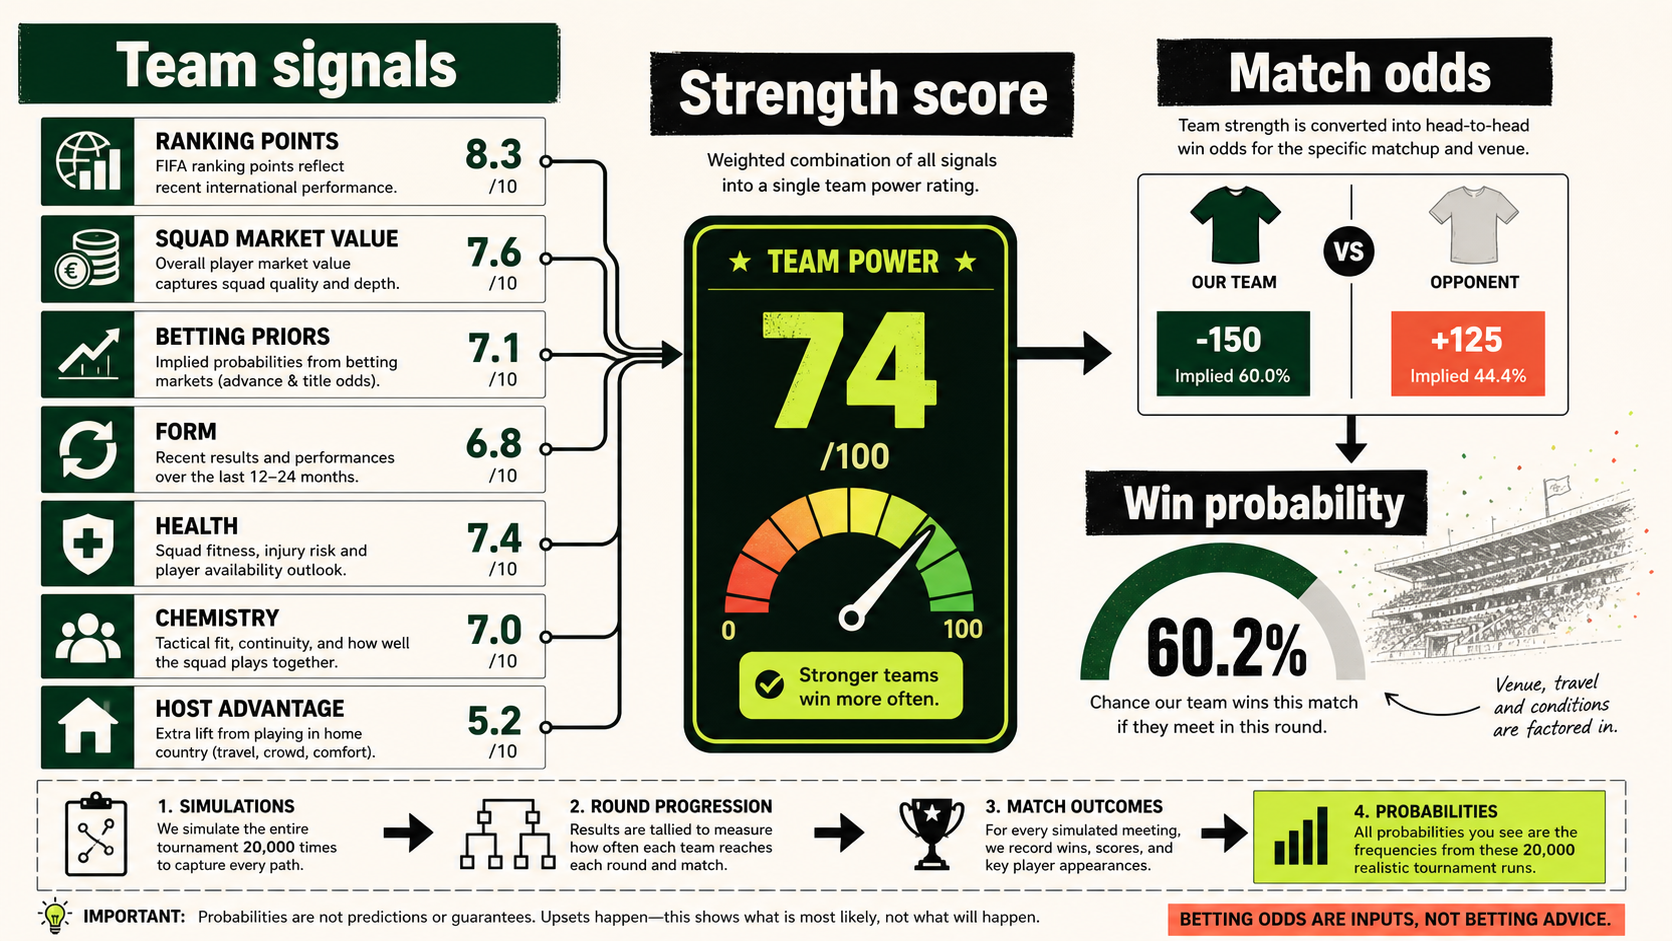
Each team starts with observable football signals and transparent assumptions. We use the signals to estimate relative team strength, not to hard-code a winner.
FIFA ranking points anchor each team's baseline quality.
Squad market value adds a market-based signal for depth and star power.
Betting-market priors convert advance and title odds into implied probabilities.
Form, health, chemistry, and host status adjust the baseline for current context.
Player availability and expected knockout usage shape player appearance chances.
Team strength score
rating = FIFA points + market value signal + odds signal + form + health + chemistry + host boost
The exact weights keep FIFA points as the anchor while allowing current market, odds, and squad-context signals to move teams up or down.
Stronger teams win more often, but every match is still sampled with randomness so upsets and narrow paths remain possible.
Knockout slot probability
P(team in M78) = count(team appears in M78) / simulations
For every match number, we count how often each team arrives there. That is the “team path” number shown in the planner.
Players
How player probabilities work
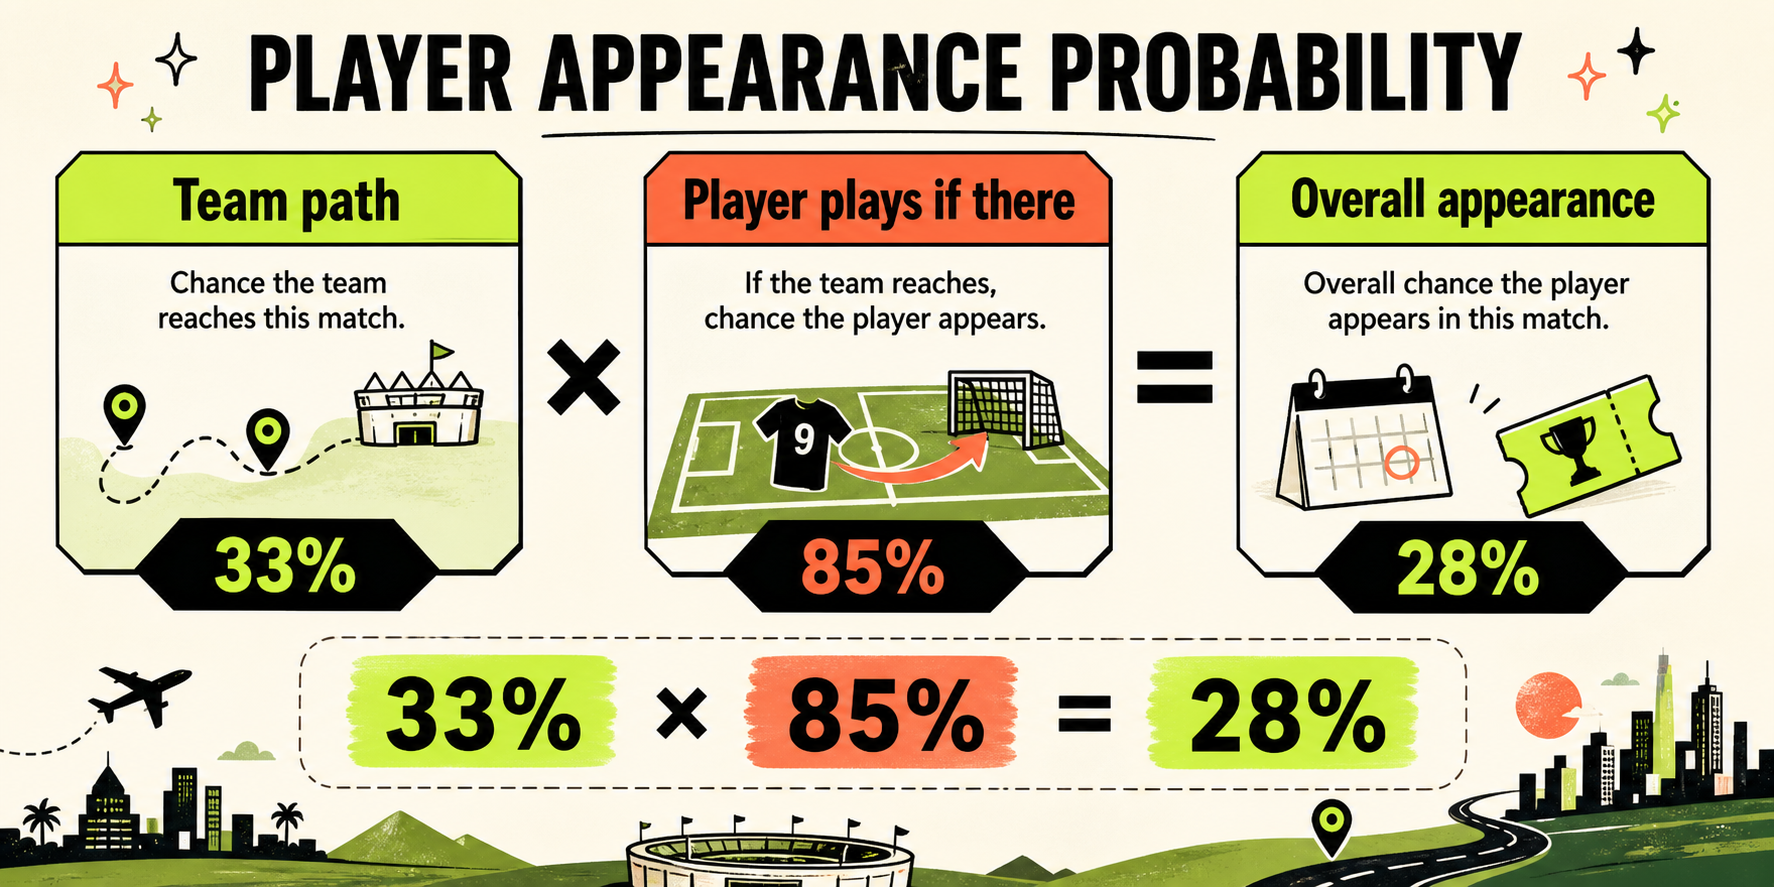
A player can only appear in a match if their team reaches that match. After that, the model applies availability, status, expected usage, and later-round attrition.
Core equationP(player appears in match) = P(team reaches match) × P(player appears | team reaches)
Example: if Norway has a 33% path to a match and the player has an 85% chance to play if Norway gets there, the overall player appearance chance is about 28%.
Reading the app
Every percent on the planner
These labels are meant to answer different fan questions: who might be there, who might play, who might win, and which exact matchup is most likely.
Team reaches match
How often that team appears in that exact knockout fixture across all simulated tournaments.
Player appearance
How often that player appears in that exact fixture. It equals team path probability times player-play probability if the team gets there.
If team reaches
The conditional chance the player appears after their team has already reached that match.
Pairing chip
The probability of a specific team-vs-team matchup happening in that match slot.
Win if there
For team mode, the conditional chance the team wins that match once it has reached it.
Match top-player chance
The chance the match contains at least one elite tracked player from either side.
Nerdy facts
20,000 simulations: enough to make the biggest match-slot probabilities stable to roughly a few tenths of a percentage point from simulation noise alone.
Odds are inputs: betting markets are useful crowd-price signals, but they are blended with football data and are not treated as advice.
Path-aware players: a player on a strong team can have more late-round chances even if their conditional appearance rate is similar to another player.
Matchups matter: a match slot can be likely for one team while the exact opponent remains highly uncertain.